Grip Strength Chart by Age: What's Normal, What It Means
Grip strength by age and sex from a large UK study: what counts as low, what the research shows, and how to train it.
If you searched for a grip strength chart, you probably want two things fast: your number in context, and a straight answer on whether it matters. Both are reasonable to want, and both deserve more care than a single line on a page selling hand grippers.
A stronger grip is consistently linked to better health outcomes across some of the largest population studies ever run. That much is well established. What gets lost in most coverage is the difference between "linked to" and "causes," and between a chart telling you what's typical and a clinical threshold telling you when to pay attention. This guide keeps those distinctions intact.
A note on health information: This is general information, not medical advice. The mortality research described below is observational, meaning it can show associations but cannot prove that grip strength itself determines how long someone lives. If you have a health condition, notice a sudden change in strength, or are unsure what your number means, talk to a healthcare professional.
The 30-second answer
Grip strength peaks in your late 20s to late 30s, declines gradually after that, and is one of the more reliable, low-cost markers researchers use to study aging and physical resilience. It is genuinely trainable at any age. It is not a lever proven to extend your life on its own.
- Typical peak: around 51 kg (men) and 31 kg (women), based on a large UK reference study
- Decline pattern: a plateau through midlife, then a gradual, accelerating drop from around your 60s onward
- Low grip strength: has two separate meanings (a statistical outlier for your age group, or a specific clinical screening threshold), and this page keeps them separate
- Mortality link: real and replicated across large studies, but it is an association, not proof of cause
- Training it: works, with a modest but real average effect from structured resistance training
- What it isn't: a diagnosis by itself, and not a guaranteed way to extend lifespan
Grip strength chart by age
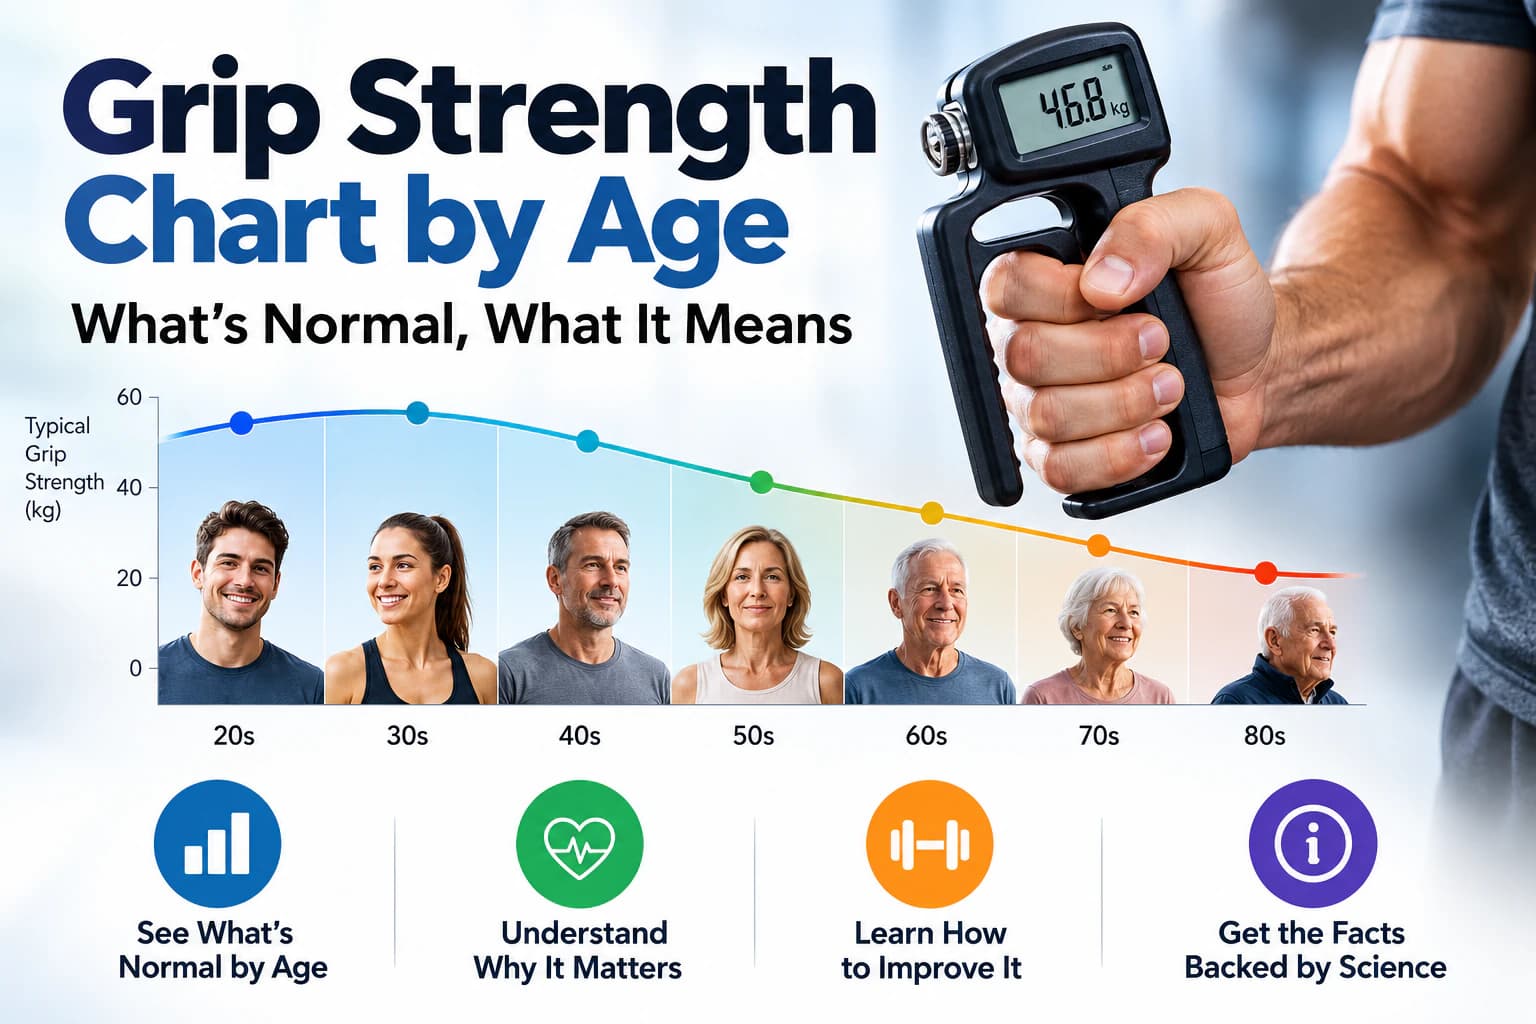
One of the largest peer-reviewed reference datasets available for this purpose comes from a 2014 study in PLOS ONE, Grip Strength across the Life Course: Normative Data from Twelve British Studies. Researchers pooled results from 12 general-population studies in Great Britain, covering 60,803 grip-strength measurements from 49,964 people, ages 4 to 90.
This is a UK population dataset. It is one of the largest peer-reviewed sources of its kind available for a chart like this, and a sensitivity analysis within the study found the results held up despite differences in dynamometer type and testing position across the underlying studies. But "large and well-conducted" is not the same as "universal," and the section right after this chart explains exactly why.
| Age | Men's median grip strength (kg) | Women's median grip strength (kg) |
|---|---|---|
| 20 | 40 | 28 |
| 30 | 51 | 31 |
| 40 | 50 | 31 |
| 50 | 48 | 29 |
| 60 | 45 | 27 |
| 70 | 39 | 24 |
| 80 | 32 | 19 |
| 90 | 25 | 14 |
These are the median (50th percentile) values the study itself reports at each age shown, modeled from the pooled data rather than approximated. The source also reports 10th, 25th, 75th and 90th percentile values at closer age intervals for readers who want more than the median; this table uses only the median at each decade to stay readable, without inventing anything the paper didn't report. The underlying pattern is a smooth curve, not a step function: grip strength keeps rising or falling between the ages shown rather than jumping at each row, and men's peak (51 kg) spans roughly ages 29-39 while women's peak (31 kg) spans roughly ages 26-42, which is why the 30 and 40 rows above show the same 31 kg for women but a slight dip for men.
How to read your own number against this: if you're in your late 20s to late 30s and near the peak figures for your sex, that's consistent with this dataset's typical range. If you're older, some decline from peak is expected and normal; the question worth asking is whether your number sits meaningfully below where people your age and sex typically land, not whether you match the 30-year-old peak.
Why this chart isn't a universal standard
A separate 2016 study by the same lead researchers, Global variation in grip strength: a systematic review and meta-analysis of normative data, pooled 96,537 grip-strength observations from 27 countries across seven world regions and compared them all against the British centiles above.
The finding worth sitting with: grip-strength data from other developed regions was broadly similar to the British reference (about 0.12 standard deviations higher, on average). Data from developing regions was clearly and consistently lower: about 0.85 standard deviations below the British centiles. That is a large, population-level gap, and it means a chart built entirely on British data will systematically read as "below normal" for populations it was never validated on.
For comparison, two other reference efforts exist and illustrate the same point from a different angle. A 2018 study produced US-specific reference equations for ages 18-85, rather than a fixed chart, since it modeled grip strength against age, sex, height and weight together. Separately, the German National Cohort study, covering more than 200,000 adults, calculated its own population-specific low-grip cutoffs, and they came out 2 kg higher than a commonly used European clinical threshold (more on that threshold below), simply because it was measured in a different population. Reference values are population-specific by nature. None of these datasets have been blended here; each is reported as its own source, because averaging incompatible populations together would produce a number nobody actually measured.
The practical takeaway: use the chart above as a reference point from one well-conducted UK study, not as a global pass-or-fail line, especially if your population differs from the British reference population, because reference values can differ meaningfully between populations.
What the chart actually means
A chart like this answers one narrow question: how does your number compare with a large sample of people the same age and sex, in the population that was studied? It does not, on its own, tell you anything about your health, your risk of disease, or what you should do next.
Three separate ideas get flattened into "the chart" that are worth keeping apart:
- A population norm: what's typical for people your age and sex in a specific reference dataset
- A statistical outlier: being unusually weak relative to your peers, which the UK study defines as roughly 2.5 standard deviations below the peak mean for your sex
- A clinical screening threshold: a specific cut-off used by clinicians to flag people worth assessing further, covered in detail below
These are different tools built for different jobs. A norm chart is descriptive. A clinical threshold is a screening trigger, not a diagnosis. Confusing the two is where most consumer coverage of this topic goes wrong.
How to test your grip strength properly
The research this page draws on almost universally uses a hand dynamometer, following a standardized position recommended by the American Society of Hand Therapists:
- Seated, with back, pelvis and knees close to a 90-degree angle
- Shoulder relaxed at your side, in a neutral rotation
- Elbow bent at 90 degrees, forearm in a neutral (thumb-up) position
- Wrist held roughly straight, allowing 0-15 degrees of ulnar deviation
- Arm unsupported: not resting on a table, armrest, or your leg
- Dynamometer held vertically, in line with the forearm
The protocol: three trials per hand, squeezing as hard as possible for about 3 seconds each, with roughly 30 seconds of rest between trials to avoid fatigue skewing the result.
One detail that matters more than it seems: studies differ on whether they report the maximum of the three trials or the average of the three trials. Neither convention is universally "correct" (they're just different reporting choices), but it means your number can shift depending on which method you (or an app, or a clinic) use. If you're comparing your result to a published chart, using the same convention the chart used matters more than most people realize.
Home testing, honestly
A basic consumer hand dynamometer, used with the body position above, is a reasonable self-tracking tool, useful for watching your own number change over weeks or months. It is not guaranteed to be calibrated identically to the clinical-grade Jamar dynamometer used in most reference research, so treat a home reading as approximate, not as a precise match to the charts above.
What isn't a substitute: a tennis-ball squeeze, a subjective "how strong does this feel" test, or timing a dead hang. These can track your own trend loosely over time, but they don't produce a number in kilograms that means anything against a published reference chart, and presenting one as equivalent to a real measurement would be misleading.
Safety note: skip maximal-effort testing if you have an active hand or wrist injury, a recent surgery in the area, or an inflammatory flare (such as active rheumatoid arthritis). Test another time, or ask a healthcare professional first.
What counts as low grip strength?
This is where the two different definitions from earlier become concrete.
The statistical definition (Dodds et al., UK data): "weak grip" is roughly 2.5 standard deviations below the peak mean for your sex. This is a description relative to a specific population's distribution: it tells you that you're an outlier compared with British study participants, nothing more.
The clinical definition (EWGSOP2, the European Working Group on Sarcopenia in Older People's 2019 consensus): grip strength below 27 kg for men or 16 kg for women is used as a screening flag for probable low muscle strength. This isn't an independently-derived number: EWGSOP2 built it by applying that same below-peak-mean statistical approach to Dodds' British normative data, so the two definitions above share the same underlying dataset rather than coming from separate populations.
Neither number is "the" correct cutoff, because both are population-specific. The German National Cohort study, using more than 200,000 German adults, calculated its own cutoffs at 29 kg for men and 18 kg for women (about 2 kg higher than EWGSOP2's figures) simply because it measured a different population. In a validation dataset, using the German cutoffs flagged roughly 1.5 times as many people as "low strength" compared with using the EWGSOP2 cutoffs on the same people. Same bodies, different reference standard, meaningfully different result.
What this means practically: a single kilogram figure being "below the line" depends entirely on which line, drawn from which population, you're comparing against. Treat any threshold as a screening signal worth further attention, not a fixed biological fact about your body.
Grip strength vs. sarcopenia
Sarcopenia (the age-related loss of muscle mass and function) gets mentioned constantly alongside grip strength, and the two get conflated more often than almost any other pairing on this topic. They are related but distinct, and the EWGSOP2 framework is explicit about how they connect.
The three-tier framework:
- Probable sarcopenia: low muscle strength alone (this is where a low grip-strength reading fits, on its own)
- Confirmed sarcopenia: probable sarcopenia plus low muscle quantity or quality, typically measured with a scan such as DXA or bioelectrical impedance
- Severe sarcopenia: confirmed sarcopenia plus reduced physical performance, such as slow walking speed
A low grip-strength number, by itself, lands you at step one: "probable." It is a reason to look further, using additional measures a clinician would order, not a diagnosis you can reach from a home dynamometer reading. This is the single most important distinction on this page, because it's also the one most commercial content skips past.
Do not read this section as: "if your grip is below [X] kg, you have sarcopenia." The accurate version is: a value below a screening threshold can be used as one signal suggesting probable low muscle strength, and that signal is worth following up on, not a standalone diagnosis.
What grip strength has to do with longevity
Here is where grip strength gets genuinely interesting to researchers, and also where headlines tend to run ahead of the evidence. Grip strength is cheap to measure, takes about a minute, requires no special training to administer, and turns out to correlate meaningfully with a range of health outcomes in population studies. That combination (cheap, fast, and informative at a population level) is exactly why it's been measured in cohort studies covering hundreds of thousands of people across decades.
It sits in the same family as other simple, well-studied markers we've covered on RoamWell, like interval walking and normal HRV by age, measurements that are easy to take and turn out to carry real signal about health, without being the whole story on their own.
What follows is a look at what the largest and most-cited studies actually found, in their own terms, without rounding the language up to something stronger than the data supports.
What the big studies actually found
The landmark study is the Prospective Urban-Rural Epidemiology (PURE) study, led by Leong and colleagues and published in The Lancet in 2015. It followed 139,691 people across 17 countries with varying income levels, for a median of 4.0 years.
| Outcome | Association per 5 kg lower grip strength |
|---|---|
| All-cause mortality | 16% higher risk (HR 1.16, 95% CI 1.13-1.20) |
| Cardiovascular mortality | 17% higher risk (HR 1.17, 95% CI 1.11-1.24) |
| Non-cardiovascular mortality | 17% higher risk (HR 1.17, 95% CI 1.12-1.21) |
| Myocardial infarction | 7% higher risk (HR 1.07, 95% CI 1.02-1.11) |
| Stroke | 9% higher risk (HR 1.09, 95% CI 1.05-1.15) |
Notably, the study's authors found grip strength was a stronger predictor of all-cause and cardiovascular mortality than systolic blood pressure, a measurement doctors take far more routinely. That comparison is a large part of why grip strength attracted so much research attention afterward.
More recent evidence adds to the picture without overturning it. A 2026 analysis of 12,693 European adults aged 50 and older, followed for 16 years through the Survey of Health, Ageing and Retirement in Europe, found higher grip strength remained associated with lower all-cause mortality independent of smoking status and independent of alcohol use, evidence that the association isn't simply explained away by healthier lifestyle habits clustering together with a stronger grip.
A 2024 analysis of 9,583 US adults from NHANES data found the same direction of association using several different grip-strength measurement approaches, with average grip strength across both hands emerging as the strongest single predictor among the metrics tested.
What connects all of these: every one is observational. Researchers measured people's existing grip strength and then tracked what happened to them over years; nobody was assigned to have a stronger or weaker grip and then followed to see the effect. That design can reveal genuine, replicated associations across huge, diverse populations, which is exactly what's happened here. It cannot, by itself, prove that grip strength causes the outcomes it's associated with.
Does stronger grip mean you'll live longer?
This is the question worth answering directly, because it's the one most likely to get overstated.
No study has shown that increasing your grip strength extends your life. The mortality evidence above comes entirely from observing people's grip strength as it already was, not from trials where people trained their grip and were then tracked for survival. That is an important, specific gap in the evidence, and it is not a technicality: it changes what you can honestly claim.
The more defensible interpretation, and the one the researchers behind these studies generally favor, is that grip strength works as a marker (a simple, inexpensive proxy for broader muscle function, neuromuscular health, nutritional status and overall physical resilience) rather than a lone causal lever. A weak grip may reflect underlying frailty or declining health more than it independently causes worse outcomes. Improving your number is a reasonable, low-risk thing to do for its own sake (better function, more capable hands and forearms, some contribution to broader strength), but it should not be sold as a proven way to add years to your life, because that specific claim has not been tested.
How to improve grip strength
The good news: grip strength responds to training, and the evidence for that is considerably more direct than the mortality-marker research above, because trials have actually tested it.
General resistance training has the strongest evidence base. A systematic review and network meta-analysis of 42 trials in 3,728 older adults found resistance training alone improved handgrip strength by an average of 2.69 kg (95% CI 1.78-3.61) compared with usual care, moderate-certainty evidence of a genuine, if modest, effect. That evidence comes from older and sarcopenic populations specifically, and it shows an effect on grip strength itself, not on mortality. If you're not already doing any structured resistance work, our guide to how much strength training you actually need is a reasonable place to start before adding grip-specific work on top.
In older adults specifically, a more detailed picture exists. A 2025 Bayesian network meta-analysis of 13 trials in older adults with sarcopenia (average age around 68) identified an "optimal" dose of roughly 3 sessions a week at about 49% of one-rep max, sustained for around 19 weeks, with effective programs generally falling somewhere in the range of 2-5 sessions a week, 30-75% intensity, and 4-24 weeks in duration.
Important limitation: that dosing data comes specifically from trials in older, sarcopenic adults. It is real, useful evidence, but it should not be repackaged as a universal beginner prescription for every reader. What follows below separates what's actually been tested from what's a reasonable, clearly-labeled practical starting point for a general audience.
Grip-strength types and which exercises train them
Grip strength isn't one single thing. Three broad categories cover most of what matters, and understanding them explains why a varied routine works better than repeating one exercise:
- Crush grip: closing the whole hand forcefully (a handshake, a hand gripper, opening a jar)
- Support grip: holding on over time (a loaded carry, hanging from a bar, carrying luggage)
- Pinch grip: squeezing between the thumb and fingers (turning a key, holding a plate by its edge)
| Exercise | Grip type trained | Practical usefulness | Evidence caveat |
|---|---|---|---|
| General resistance training | Multiple | High: broadest, strongest evidence base | Effect size is modest, not dramatic |
| Farmer's carries | Support (plus forearms, traps, core) | High: simple, requires only something heavy | Practical/physiological reasoning; not isolated in a dedicated large trial |
| Hand grippers | Crush | Moderate: cheap, portable | Limited direct trial evidence as a standalone method |
| Dead hangs | Support (isometric) | Moderate: no equipment beyond a bar | Limited direct trial evidence specifically isolating hangs |
| Pinch-grip work (plate pinches) | Pinch | Moderate: targeted, simple | Practical reasoning more than dedicated trial evidence |
| Wrist flexion/extension | Crush and support support muscles | Moderate | Grounded in general strength-transfer principles, not a large grip-specific trial base |
None of these should be described as proven to change mortality risk. They are reasonable, evidence-informed ways to build a specific physical capacity (grip strength itself), which is a legitimate goal on its own terms.
Beginner progression
This is a practical starting framework, not a finding lifted directly from a clinical trial. Treat it as sensible programming built on general strength-training principles, clearly separate from the older-adult dosing data above.
- Frequency: 2-3 sessions a week, non-consecutive days, is a reasonable starting point for most general-population readers
- Structure: pick one exercise from each category above; for example, farmer's carries (support), hand grippers or a firm handshake-style squeeze (crush), and a light plate pinch (pinch)
- Starting volume: 2-3 sets of a manageable duration or repetition count, stopping well short of failure in the first few weeks
- Progression: add a small amount of weight, time, or distance every couple of weeks once the current level feels comfortable; the same progressive-overload principle that applies to any strength training
- Recovery: grip and forearm muscles recover reasonably quickly, but soreness or persistent fatigue in the hands or forearms is a signal to back off, not push through
If you already do structured resistance training (including a program like our 30-day home workout plan), grip work fits naturally as an addition rather than a separate program: carries, dead hangs, or gripper work slot in at the end of an existing session.
Who should train grip?
The evidence and the practical case for training grip strength aren't uniform across every reader. A few groups stand out clearly:
- Older adults, and anyone concerned about age-related muscle loss: this is where the strongest dedicated trial evidence sits, and where the sarcopenia framework applies most directly
- People doing loaded carries or rucking: sustained pack-strap or carry weight already demands support grip, so dedicated grip work complements training that's already happening; our rucking guide covers the loaded-carry side of this in more depth
- Lifters: grip is a well-known limiting factor in deadlifts, rows and carries, where a weak grip can cap progress in a lift that's otherwise well within reach
- Hybrid-race and event athletes: carries like the farmer's carry appear directly in race formats such as HYROX, where grip endurance affects the whole station, not just the lift
- Climbers and combat-sport athletes: grip is directly performance-relevant in these sports specifically
- Generally active adults with no particular risk factors: a reasonable, low-cost, optional addition, not something the evidence frames as a necessity
Nothing here should be read as "everyone needs a dedicated grip program." For a healthy, generally active adult, it's a sensible extra, not a proven requirement.
Safety and when to get individualized advice
Grip training is low-risk for most people when approached the way any strength training should be: gradually, with attention to how the hands and wrists respond.
- Avoid maximal-effort grip testing or training during an active hand or wrist injury, a recent surgery in the area, or an inflammatory flare (such as an active rheumatoid arthritis flare)
- Progress load, time, or repetitions gradually rather than jumping straight to heavy carries or long hangs
- Be cautious with high-volume gripping or hanging if you're new to it: forearm and hand tissues, like any others, need time to adapt
- Numbness, tingling, or sharp pain during or after grip work is a signal to stop and reassess, not push through
- If you have an existing hand or wrist condition, are recovering from surgery, or have a diagnosed nerve issue such as carpal tunnel syndrome, get individualized guidance from a healthcare professional before starting a dedicated grip-training program
None of this is a diagnostic checklist. It's the same sensible caution that applies to starting any new form of resistance training.
The bottom line
A grip-strength chart can tell you something real: roughly how your number compares with a large group of people your age and sex, in the specific population that was studied. From there, the honest picture gets more layered than most headlines suggest.
Grip strength genuinely declines with age, genuinely correlates with mortality risk in some of the largest cohort studies available, and is genuinely trainable with a modest, real effect from structured resistance work. What it isn't: a diagnosis on its own, a number with one universal cutoff that applies to every population on earth, or a proven lever you can pull to add years to your life.
Know your number, understand what it's actually measuring, and treat it as one useful signal among many, not a verdict.
Related reads:
Frequently asked questions
Answers to the most common questions about this topic.
Yes, and the pattern is consistent across large studies: a rise through the 20s, a plateau through midlife, then a gradual decline that accelerates in later decades. In the UK reference data, the prevalence of statistically weak grip reaches roughly 23% in men and 27% in women by age 80.
Yes. Carrying groceries or bags with intention, hanging from a sturdy bar, squeezing a towel or a stress ball, and doing wrist curls with a household weight all provide real stimulus. A gym makes progressive loading more convenient, but it is not required to see improvement.
It is reasonable to. Most people have a dominant hand that is somewhat stronger, and reference studies typically report values by hand or take the higher of the two. Training both hands supports balanced function for everyday tasks, even though most norm charts and research focus on the stronger hand.
The evidence base is strongest in older adults, where grip strength connects most directly to independence, fall risk and the sarcopenia framework clinicians use. That does not make it irrelevant earlier in life, but the research specifically linking grip strength to health outcomes is concentrated in middle-aged and older populations.
If your grip strength has dropped noticeably over a short period, if it sits well below the reference ranges for your age and sex, if you also notice broader weakness, unintended weight loss, or difficulty with daily tasks, or if you have an existing hand or wrist condition affecting testing, it is worth raising with a healthcare professional rather than self-diagnosing from a chart.
Filed under
Written by
We research travel, fitness and wellness, and publish what holds up. See our editorial policy.