Normal HRV by Age: Research vs. Wearable Numbers
Normal HRV by age from real studies: RMSSD and SDNN reference values, and why your wearable's number may differ.
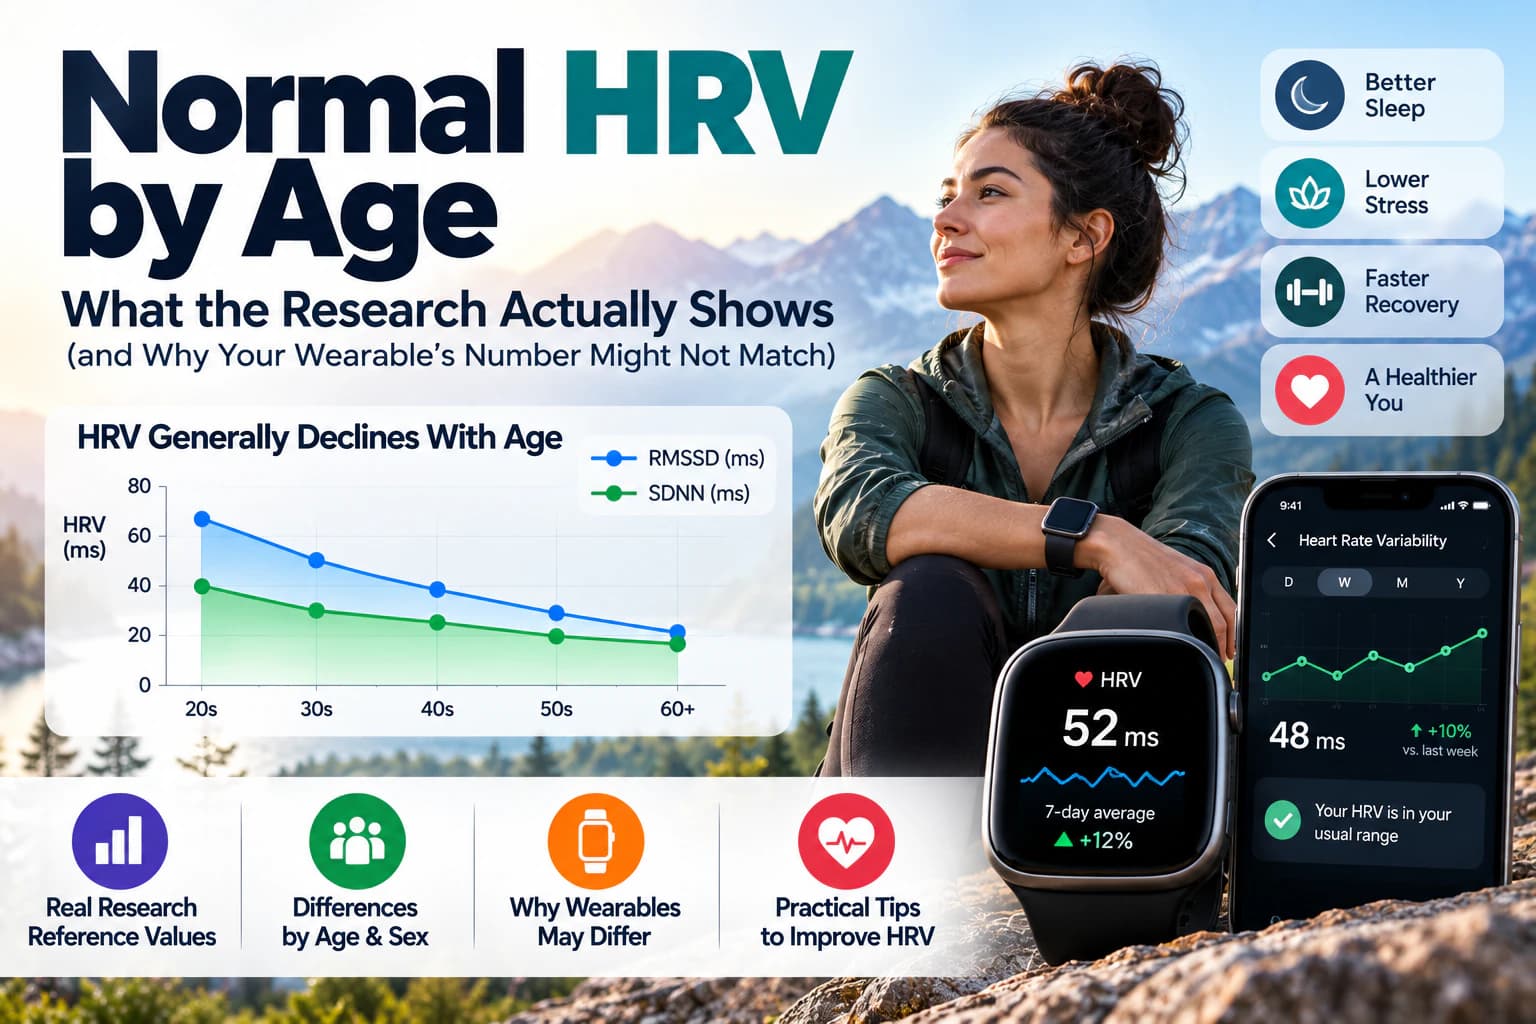
If you've looked at your wearable's HRV number and then gone searching for what counts as normal, you've probably run into the same problem twice: every page gives you a different range, and none of them agree with what your ring or watch is actually showing you. That's not you doing something wrong. It's because "HRV" isn't one number, and most pages publishing a "normal HRV by age" chart don't say which metric, which population, or which measurement method their numbers actually came from.
This page does. It uses two real, peer-reviewed reference datasets, states exactly what each one measured and how, and explains directly why your Whoop, Oura, Garmin or Apple Watch reading may not land anywhere near either table.
A note on health information: This is general information, not medical advice. HRV is not a diagnostic test, and a single reading cannot tell you what's happening in your body with any certainty. If you have a cardiovascular condition, notice a persistent unexplained change, or have symptoms that concern you, talk to a healthcare professional rather than interpreting a wearable number on your own.
The 30-second answer
There is no single universal "normal HRV." Published reference values depend on which metric was used (RMSSD or SDNN, which are not interchangeable), which population was studied, and how the reading was taken. Two real research datasets are reproduced below, each clearly labeled. Your own trend over time, on the same device, is generally more useful than trying to match either one.
- RMSSD (a South Indian cohort, ages under 30 to 60+): falls from 47 ms to 26 ms with age
- SDNN (a South Korean cohort, by age and sex): falls from roughly the low 40s to the low-to-mid 20s (ms) across the 20s to 60s
- Metric matters: Garmin, Oura and Whoop report RMSSD; Apple Watch reports SDNN. They are not comparable
- Condition matters: short resting recordings and overnight sleep-derived wearable readings are not the same measurement
- What actually helps: consistent sleep, regular exercise and less alcohol have the strongest evidence behind them
- What HRV isn't: a diagnostic test, and not a metric you should try to "optimize" in isolation
What HRV actually measures, briefly
Your heart doesn't beat on a perfectly even metronome. The tiny variations in time between consecutive beats are what heart rate variability describes, and those variations are influenced by your autonomic nervous system, including parasympathetic ("rest and digest") and sympathetic ("fight or flight") activity, along with breathing, blood-pressure regulation, and other physiological factors. Broadly speaking, a higher reading tends to reflect more parasympathetic influence at the time of measurement, and a lower one tends to reflect more sympathetic dominance. The measurement framework behind almost all modern HRV research traces back to a 1996 standards document from the European Society of Cardiology and the North American Society of Pacing and Electrophysiology, which is still the reference point researchers cite when defining these metrics.
That's genuinely useful as a concept. It's also as far as most consumer explanations go before jumping straight to "so what's normal," which is where the real complexity starts.
Why "normal HRV" is harder than it sounds
HRV is not one interchangeable number, and treating it as one is the single biggest source of confusion in this space.
There are several distinct HRV metrics, calculated differently and describing different things:
- RMSSD (root mean square of successive differences): a time-domain measure strongly influenced by parasympathetic, or vagal, activity and commonly used as a marker of short-term vagal modulation, and it stays reasonably stable even in short recordings.
- SDNN (standard deviation of NN intervals): a time-domain measure reflecting overall variability from both nervous system branches, which generally needs a longer recording to be reliable.
These two numbers are not on the same scale, and one cannot be converted into the other with any real accuracy. That alone explains a lot of the "why don't these charts agree" confusion. But it doesn't stop there. Even using the exact same metric, values differ by:
- Measurement duration: a 5-minute resting recording and a full night of sleep produce different numbers.
- Body position and activity: seated, supine, resting, and exercising readings are not comparable to each other.
- Time of day: HRV is not flat across 24 hours.
- Recording device: a clinical ECG, a finger-based PPG sensor, and a wrist- or finger-worn consumer device do not agree perfectly with each other, even when measuring the same person at the same moment.
- Population studied: age, sex, fitness level, and the country or ethnic group studied all shift the underlying reference values.
A published "normal HRV" number only means something once you know which of these boxes it's checking. Given that, this page does not present one merged chart. It presents two, each fully labeled, side by side.
RMSSD research reference by age
This table comes from a 2026 study of 249 healthy adults at AIIMS Bibinagar in South India (mean age 42, roughly 15 years). HRV was recorded from a lead II ECG, 5 minutes, supine position, after a 10-minute rest, with spontaneous (unguided) breathing.
| Age band | RMSSD (mean ± SD) | Sample size |
|---|---|---|
| Under 30 | 47 ± 26 ms | n = 67 |
| 30 to 59 | 29 ± 23 ms | n = 136 |
| 60 and older | 26 ± 36 ms | n = 46 |
How to read this table. These are age-band averages from one South Indian clinical cohort, not a universal target. The study did not publish a version of this table broken down by sex within each age band, only age-pooled values like the ones above and a separate, age-pooled sex comparison (more on that below), so this page reports exactly what was published rather than inventing combined rows.
This is a research reference for a specific population, measured under specific, controlled conditions. It is the metric that Garmin, Oura and Whoop use, which makes it the more directly relevant of the two tables for most wearable owners, but see the wearable section below before assuming your device's number should land in this range.
What Singhal's data says about sex differences
The same study also reported RMSSD separately by sex, pooled across all ages: women averaged 34 ± 26 ms, men averaged 32 ± 30 ms, a difference that was not statistically significant (p = 0.6). SDNN showed the same pattern: 37 ± 20 ms for women versus 37 ± 22 ms for men (p > 0.9, not significant). The one measure that did differ significantly by sex was pNN50 (a related but different metric): 15 ± 18 for women versus 10 ± 16 for men (p = 0.015). Put plainly, this dataset does not support a broad claim that women have higher RMSSD or SDNN than men. Sex differences in HRV appear to depend on which specific metric you're looking at, not on a simple, universal rule.
SDNN research reference by age and sex
This table comes from a 2020 study of 291 healthy South Korean adults, split into five age bands with roughly 30 men and 30 women per band. HRV was recorded using a finger-worn photoplethysmography (PPG) device, 5 minutes, seated, between 9am and 6pm, with instructions to breathe normally rather than deeply.
| Age | Men, SDNN | Women, SDNN | Men, pNN50 | Women, pNN50 |
|---|---|---|---|---|
| 20s | 41.66 ± 11.17 ms | 44.45 ± 12.60 ms | 37.80 ± 13.13% | 39.69 ± 12.97% |
| 30s | 36.58 ± 9.96 ms | 34.48 ± 9.41 ms | 32.45 ± 12.73% | 29.96 ± 13.04% |
| 40s | 30.35 ± 9.80 ms | 30.06 ± 10.32 ms | 24.25 ± 13.72% | 23.66 ± 13.34% |
| 50s | 24.47 ± 9.64 ms | 28.58 ± 9.46 ms | 14.98 ± 13.12% | 21.00 ± 13.07% |
| 60s | 24.65 ± 7.97 ms | 22.34 ± 7.57 ms | 15.47 ± 11.05% | 12.40 ± 10.91% |
pNN50 is a related but separate time-domain metric (the percentage of consecutive beat-to-beat intervals differing by more than 50 milliseconds), included here because it's part of the same published dataset, not because it's interchangeable with SDNN.
Important: this study did not measure RMSSD. Only SDNN, pNN50, and frequency-domain values were reported. If you've seen this dataset cited elsewhere as an "RMSSD chart," that's a mislabeling of the original research, not something this table will repeat.
The study's own analysis found no statistically significant overall sex difference across most HRV parameters measured, including SDNN, aside from two isolated exceptions in a frequency-domain measure (LF) at the 40s and 50s age bands specifically. The age-related decline, on the other hand, was clear and consistent for both sexes.
This is the metric Apple Watch reports, which makes this table the more directly relevant reference if you're comparing against an Apple Watch reading, subject to the same measurement-condition caveats covered next.
A second SDNN data point, for context. The same South Indian study behind the RMSSD table above also reported SDNN by age (sexes pooled): under 30, 48 ± 18 ms; 30 to 59, 33 ± 19 ms; 60 and older, 31 ± 27 ms. It's a different population, a different recording method (ECG rather than PPG) and a different age grouping than the Korean data, so it isn't merged into the table above. It's included here as a second, independently useful reference point, and the fact that both cohorts show the same downward direction with age, despite being different populations measured differently, is itself a reasonably solid finding.
Why different studies produce different HRV numbers
Beyond the RMSSD-versus-SDNN split, it's worth understanding why even two studies measuring the same metric can land on different numbers.
The most frequently cited HRV reference work in the field is a 2010 meta-analysis that pooled 44 short-term studies covering 21,438 healthy adults, predominantly from Western research. It's a genuinely important paper, useful as broad supporting evidence that short-term resting HRV reference ranges exist and have been extensively studied, and it did not provide an age-specific breakdown of its own, only a single pooled adult figure. This page deliberately doesn't reproduce its exact pooled numbers, because the original figures could not be independently re-verified against the primary paper during this article's research process, and republishing a number without direct confirmation isn't a standard worth relaxing just because it's a widely quoted one.
The two datasets used in the tables above, one South Indian and one South Korean, were chosen instead because their exact figures were pulled directly from the published results. Neither should be read as a global standard. Both are described elsewhere in the HRV literature as a real, acknowledged gap: most existing HRV reference data comes from Western populations, and region-specific data like the two cohorts here remain comparatively rare. Treat each table as a genuine, useful data point from a specific, named population, not as evidence for what's "normal" everywhere.
Why your wearable's HRV may not match these tables
This is usually the part that causes the most confusion, so it's worth being direct about it.
| Device | Metric reported | Typical measurement context | Directly comparable to the tables above? |
|---|---|---|---|
| Whoop | RMSSD | Overnight, during your deepest sleep period | No |
| Oura | RMSSD | Overnight, aggregated across multiple sleep segments | No |
| Garmin | RMSSD | Varies by model and mode | No |
| Apple Watch | SDNN | Spot readings, taken ad hoc | No, a different metric entirely |
Three separate mismatches stack up here. First, the metric itself: if you're wearing an Apple Watch, you are looking at SDNN, and neither table above should be read as your personal target, because both were built around different metrics or different populations than a direct one-to-one match requires. Second, the measurement window: research studies typically use short, controlled, awake resting recordings, while Whoop and Oura calculate HRV specifically from sleep, using their own proprietary smoothing and averaging. Third, the sensor and algorithm: consumer wearables use wrist- or finger-based PPG sensors and proprietary processing, not a clinical-grade ECG, and validation studies show this generally works reasonably well but not perfectly. Whoop's RMSSD has been validated against ECG with a small average bias of around 1.66%, which is a solid result. Oura's nightly RMSSD has also shown good agreement with ECG when enough clean data is available, though accuracy on some secondary frequency-domain measures is weaker. A broader look at consumer wearable HRV across several longitudinal studies underscores that these devices are approximations, useful for trend tracking but not a substitute for clinical-grade measurement.
None of this means your wearable's number is meaningless. It means the number is only really interpretable against itself over time, not against a published research table built from a different metric, population, and measurement window. Comparing your own trend, on the same device, under roughly similar conditions, is the comparison the evidence actually supports.
How to actually read your own trend
If a single day's number isn't the useful comparison, what is? A few practical habits make your own data more interpretable:
- Look at a rolling average, not one night. A week-to-week or 7-day rolling average smooths out the ordinary night-to-night noise from sleep timing, food, alcohol, or a hard workout, and makes a genuine shift easier to spot against that noise.
- Keep the comparison like-for-like. Compare weekday to weekday, or your baseline period to a similar period, rather than a big travel week against a normal week at home.
- Note the obvious explanations as they happen. A late night, a few drinks, a hard training session, or the start of a cold are all reasonable, non-alarming explanations for a lower reading the next morning. A single dip often has an ordinary explanation and is usually more useful as context than as a conclusion.
- Give a new device or a new algorithm version time. Firmware and algorithm updates can shift your baseline number overnight without anything about your body changing. If your reading suddenly jumps or drops after an app or device update, that's worth factoring in before assuming a physiological cause.
- Treat a stable or upward trend as the goal, not a specific number. Since absolute values depend so heavily on device, metric and individual physiology, a trend that's holding steady or improving relative to your own recent history is a more meaningful outcome than matching any published figure, including the ones on this page.
HRV vs. resting heart rate
These two numbers often get mentioned in the same breath, but they're measuring different things on different timelines.
Resting heart rate is simple: beats per minute while at rest. It's stable day to day, changes gradually as cardiovascular fitness improves or declines over weeks and months, and it's easy to measure consistently.
HRV is more sensitive and noisier. It can shift meaningfully from one day to the next based on sleep, stress, alcohol, illness, or training load, which makes it a more responsive short-term signal but also a harder one to interpret from a single number. It can change with illness, stress, sleep disruption, and training load, but neither HRV nor resting heart rate is a diagnostic or predictive test on its own. Neither one replaces the other, and treating a single HRV reading as more authoritative than how you actually feel is a common overreach.
What tends to lower HRV
A handful of everyday factors reliably move HRV downward, each with real supporting evidence:
- Poor or insufficient sleep. A meta-analysis of 11 studies covering 549 participants found sleep deprivation was associated with a significant drop in RMSSD and a shift toward more sympathetic, less parasympathetic influence. If your sleep has been inconsistent, our guide to sleeping better at night naturally covers a structured, evidence-based approach to fixing that.
- Alcohol. Multiple independent studies have found that acute alcohol intake measurably reduces short-term HRV, primarily by suppressing vagal (parasympathetic) tone, in a dose-dependent way. Even a moderate evening drink can show up in that night's reading.
- Acute and chronic stress. Elevated sympathetic activity, the physiological signature of stress, tends to suppress the parasympathetic signal HRV metrics are picking up. If stress and racing thoughts are a recurring problem, our guide to what a cortisol detox actually does covers what's real and what's marketing in the broader stress-hormone conversation.
- Illness. As your immune system mounts a response to infection, HRV commonly drops, sometimes ahead of other noticeable symptoms.
- Heavy training load. A hard session, or several without adequate recovery, can suppress HRV temporarily. If you're training seriously, how much strength training you actually need is worth a read for a sense of where the point of diminishing returns actually sits.
- Travel and disrupted routine. Time zone shifts, disrupted sleep, and the general chaos of travel days can all show up as a temporary HRV dip; our science-backed jet lag protocol covers the mechanisms behind why travel disrupts your body's rhythms in the first place.
A single low reading often has an ordinary explanation and is usually more useful as context than as a conclusion. A pattern that persists without an obvious explanation is the more useful thing to pay attention to.
How to improve HRV
The evidence here isn't uniform, so it's worth being honest about which recommendations are well supported and which are more exploratory.
Strongest evidence:
- Regular exercise. A systematic review and meta-analysis of 16 randomized controlled trials, 623 participants total, found structured exercise training improved several HRV measures compared with control groups, with larger effects in programs lasting eight weeks or more. This applies to both aerobic and resistance training, and if you want a sense of how much is actually enough, how much strength training you actually need walks through the dosing research directly.
- Consistent, adequate sleep. Given the sleep-deprivation evidence above, prioritizing sleep consistency is one of the more directly supported levers available.
- Limiting alcohol. The dose-dependent suppression from alcohol is well replicated, making reduced intake one of the more immediately actionable changes.
Moderate, mixed evidence:
- Paced or slow breathing. A meta-analysis of 31 studies found breathwork was associated with lower stress, with a small-to-medium effect overall. At the same time, one large, well-controlled randomized trial with 400 participants found no significant difference between a specific coherent-breathing protocol and a matched placebo control on subjective stress. The honest summary is that paced breathing is a low-risk, reasonable practice with real support behind it in aggregate, not a technique with a guaranteed individual effect.
Weaker, exploratory evidence:
- Gratitude practices and time in nature. Both appear in smaller studies with promising but far less definitive results than the categories above. Worth trying if they appeal to you; not something to build an HRV strategy around on their own.
One distinction worth holding onto: a behavior change causing an HRV change is not automatically the same as an HRV change causing a health improvement. HRV is a downstream reflection of things like sleep, training and alcohol intake, not an independent lever you're pulling directly. The reason to sleep well, train consistently and drink less is that those things are good for you in their own right; a favorable shift in your HRV trend is a plausible signal that you're on the right track, not the goal itself.
What a low HRV reading does and does not mean
A lower-than-usual reading can reflect stress, poor sleep, alcohol, illness, heavy training load, or ordinary day-to-day biological noise. It can also, in some cases, be an early signal worth noticing before more obvious symptoms appear, which is part of why some athletes and coaches use an unexplained multi-week HRV decline as one input, among several, when assessing training load and recovery.
What it does not do is diagnose anything on its own. Consumer HRV should not be used to self-diagnose anxiety, depression, an arrhythmia, cardiovascular disease, or overtraining syndrome. A narrative review of HRV applications in strength and conditioning discusses it as one useful input among several for monitoring training load, not as a standalone diagnostic tool. A single reading, or even several readings over a few days, usually reflects one or more of the ordinary explanations above rather than something requiring medical attention. Context, specifically how you actually feel, matters more than the number by itself.
When persistent changes are worth discussing with a clinician
Most day-to-day HRV fluctuation is normal and explainable. A conversation with a healthcare professional becomes more reasonable when a change is persistent, unexplained, or accompanied by other signals, rather than a single unusual reading.
Specific situations worth raising: a drop that persists for more than a couple of weeks without an obvious cause like illness, heavy travel, or a training block; a change alongside new or ongoing symptoms such as unusual fatigue, breathlessness, chest discomfort, or palpitations; or a noticeable shift alongside other health changes, including a resting heart rate that has also moved outside its normal pattern for you. It's also worth knowing that reduced HRV in older adults specifically can have identifiable medical causes beyond lifestyle factors, including cardiovascular disease, certain medications such as beta-blockers, diabetes, sleep apnea, and thyroid dysfunction, none of which a wearable can distinguish from ordinary stress or fatigue on its own.
Sudden or severe chest pain, severe breathlessness, fainting, or other acute concerning symptoms warrant urgent medical attention rather than waiting for a routine appointment.
None of this is a reason to treat every dip as alarming. It's a reason to treat a genuine, persistent, symptomatic change as worth a real conversation rather than something to self-manage from a chart.
The bottom line
There is no single "normal HRV by age." What exists is a set of research reference values, each tied to a specific metric, a specific population, and a specific measurement method, and two of the better ones are reproduced in full on this page rather than paraphrased or blended together. RMSSD, used by Garmin, Oura and Whoop, declined from 47 ms under 30 to 26 ms at 60 and older in a South Indian cohort. SDNN, used by Apple Watch, declined from the low 40s to the low-to-mid 20s across the 20s to 60s in a South Korean cohort, with no consistent sex difference in either dataset.
Your wearable's absolute number is very unlikely to land neatly in either table, and that's expected rather than a sign something is wrong: different metric, different measurement window, different population, or some combination of all three. The comparison worth making is your own reading against your own recent history, on the same device, not against a published research average built for an entirely different purpose. Used that way, HRV is a genuinely useful, low-effort signal. Used as a number to chase or compare against a stranger's device, it mostly just adds noise.
Related reads:
Frequently asked questions
Answers to the most common questions about this topic.
It depends entirely on which metric, whose device, and what age. As RMSSD, 30 ms would sit close to the 30 to 59 reference average (29 ms) in the South Indian cohort on this page. As SDNN, it would sit between the 40s and 50s reference averages in the South Korean cohort. As an Apple Watch SDNN reading compared against a Whoop or Oura RMSSD reading, the comparison doesn't work at all, because they're different calculations. A single number means very little without that context.
Written by
We research travel, fitness and wellness, and publish what holds up. See our editorial policy.